Hello, we are Republic of Korea’s No.1 game server, Backnd
Since last year, we have conducted research on uplift modeling with Graduate School of AI, KAIST, one of the causal inference.
In the process, we started the study with consent from some customers who are using our service(Backnd) to provide and disclose data, and We have achieved great results that the paper was accepted in AAAI 2023. (Once again, we would like to express gratitude to those who have helped us.)
In the field of causal inference, where research has not progressed more than in other AI fields, we decided to disclose the corresponding dataset (Backnd-TS) to contribute to the development of research.
- Go to openreview
- The dataset can be downloaded at here
- For Korean version, please refer to here
- The poster can be found at here
Backnd-TS Dataset

Official repository of the paper: Modeling Uplift from Observational Time-Series in Continual Scenarios (Oral presentation, AAAI 2023 Bridge Program for Continual Causality
Abstract
As the importance of causality in machine learning grows, we expect the model to learn the correct causal mechanism for robustness even under distribution shifts. Since most of the prior benchmarks focused on vision and language tasks, domain or temporal shifts in causal inference tasks have not been well explored. To this end, we introduce Backnd-TS dataset for modeling uplift in continual learning scenarios. We build the dataset with CRUD data and propose continual learning tasks under temporal and domain shifts.
Introduction
The Backnd-TS dataset has been developed in collaboration with Graduate School of AI, KAIST and AFI Inc., a leading Backend-as-a-Service (BaaS) company specializing in mobile games, to aid research in log-level time-series and causal inference. The dataset has been named after the service provided by AFI Inc., backnd.com, which refers to the time-series of backend server logs. As of January 2023, this service has been utilized by 3,174 mobile games, generating a cumulative user base of over 60 million, and 115 million daily transactions. By identifying valuable patterns in this log-level data, we aim to predict user behavior in order to improve the operations of game services.
The log information of most internet services is generated on a massive scale on a daily basis, however, its utility is not commensurate with its scale. As such, this log data is commonly stored in data warehouses, with only a small proportion utilized for data science and analysis. The analysis is carried out from macro-level perspectives, such as service and company level, while individual user interests or predictions receive relatively less importance. However, the task of interest in this dataset is to predict individual user behavior, ultimately contributing to improved user satisfaction and service quality. Additionally, from the perspective of machine learning and data mining, the dataset has been created with minimal pre-processing in order to reduce dependence on manual feature engineering and selection, and to incorporate more information.
Task Description
The task is composed of three subtasks, ID (In-distribution), TS (Temporal Shift), OOD (Out-of-domain), and the games used for uplift modeling are A, B, and C. This is summarized in the table below.
| Task | Train set | Valid set | Test set |
|---|---|---|---|
| ID | Game A APR + MAY | Game A APR + MAY (20% split) | – |
| TS | Game A APR + MAY | Game A APR + MAY (20% split) | Game A JUN |
| OOD w/ | Game A APR + MAY & Game B JUN | Game B JUN (20% split) | Game B JUL |
| OOD w/o | Game A APR + MAY | Game A APR + MAY (20% split) | Game C JUL |
- For ID, the performance is measured on the validation set, which is randomly sampled from the entire dataset of game A. The rest is used as the training set. Since the training and validation sets are collected from the same game and time period, we can assume that the distribution is the same, and this is used as the baseline performance measurement for the uplift model.
- For TS, the performance is evaluated on the test set, which is collected from a time point one month after the training data. This is more realistic than ID, as the uplift model predicts the behavior of future users based on a model trained on past data. If the model has learned robust features that are independent of the time axis, the performance will be similar to ID.
- For OOD, the performance is evaluated on the test set, which is collected from games B and C. This is a more general evaluation of the model’s ability to predict the behavior of users from games other than the training data. OOD is divided into two subtasks.
- For OOD w/, the new training data from game B is given, and the model is fine-tuned on the new game. The performance is evaluated on the test set, which is collected from a time point after the training data. This is a more general evaluation of the model’s ability to predict the behavior of users under a different domain.
- For OOD w/o, the performance is evaluated on the test set, which is collected from game C. This evaluates the model’s ability to predict the behavior of users from unseen games, and therefore, the model is not fine-tuned on the new game. If the model has learned robust features that are independent of the domain, the performance will not drop significantly.
Dataset Description
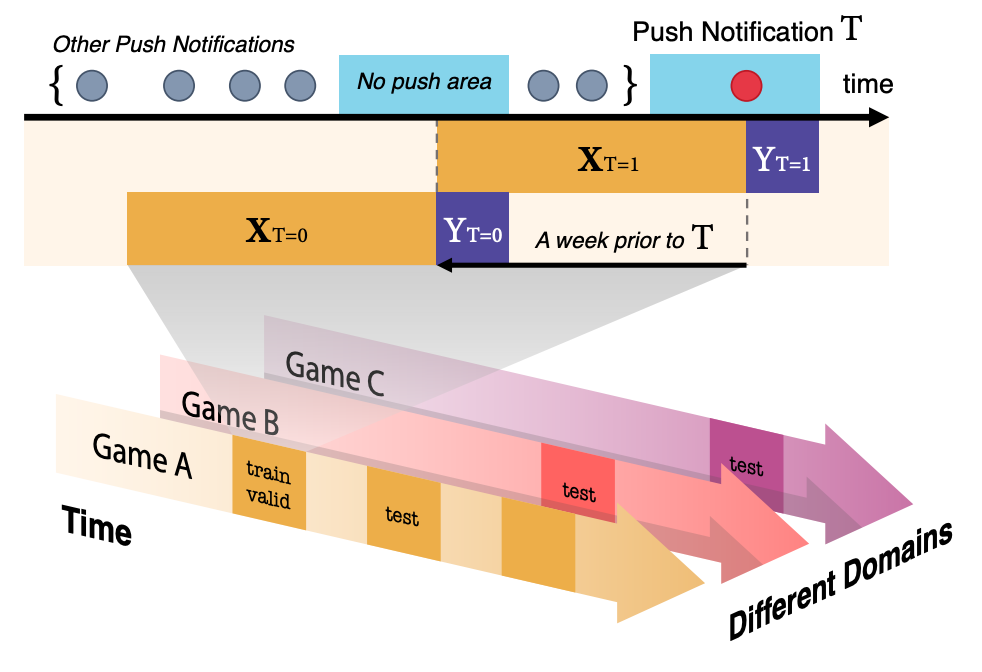
The illustration above shows the structure and tasks of the Backnd-TS dataset. The arrows with different colors indicate that there are different games within the same service sharing the same API calls, and each arrow through the time axis indicates that there may exist distribution shifts over time. Uplift modeling ultimately aims to predict the future effect of users on the treatment, so the text label “test” is located later in time than “train and valid” to reflect this.
Each data point is a triple of $(X, t, y)$. Here, $X$ is a time series data, $t, y \in { 0, 1 }$ are binary values indicating whether the user received a push notification and whether the user logged in within {3, 6, 12} hours after receiving the push notification, respectively. The paper uses 3 hours as the target, but 6 hours and 12 hours can also be used for experiments. This is because the ratio of users who access the game for reasons other than the push notification increases as the time interval increases, and the effect of the push notification itself decreases. Therefore, it is to measure the effect of the push notification itself without being affected by other push notifications.
However, this data is not collected in the environment of RCTs (Randomized Controlled Trials), but is an observational data. In other words, it is not the data that observes the response (login)v $y$ when the entire user is randomly divided into two groups, and one group is sent a push message $t=1$ and the other group is not $t=0$. When the push was sent in the game log, it was used as the control group data before exactly one week. This is called a pseudo-control group in the paper. This was used to make sure that the day of the week, the time characteristics, etc. did not affect the user’s login. There were no other factors that affected the treatment, and the control group and treatment group were assumed to be homogeneous.
Baselines
The baseline model is composed of the following components. The backbone is Temporal Convolution Network(TCN)[1], which is used to compress the time series information. The reason why TCN is used instead of RNN models such as vanilla RNN, LSTM, and GRU is that the training of long sequences is very unstable, and the reason for this is the vanishing gradient problem. TCN consists of 11 dilated convolution[2] blocks, and the receptive field is 2,048. The input is also the last 2,048 logs. Of course, other modeling techniques such as hierarchical modeling or preprocessing techniques such as binning can be used to use longer sequences, but since the purpose of this research was to provide a baseline, these methods were not used. The TCN layer is used to obtain the hidden representation $z = f(X)$. The hidden representation $z$ is used as the input of the following two models.
The uplift model used is Dragonnet[3] and Simanese Network[4]. Both use the output of the last layer of the TCN backbone as the input. Dragonnet is a method that predicts $\hat y = g(z, t)$ and propensity score $\hat t = h(z)$ at the same time, and performs regularization. In this case, the neural network $g(\cdot)$ and $h(\cdot)$ are shared at the beginning, and the fact that the propensity score prediction only needs the necessary features for causal effect inference is based on the fact. Simanese Network is a regression problem based on the fact that the expectation of $Z$ variable transformation conditioned on $X$ proposed by Athey and Imbens[5] is actually the same as the uplift value (CATE).
Usage
Load Dataset
The dataset is implemented as UpliftDataset class, which inherits torch.utils.data.Dataset. You can load the dataset with the following code.
from dataset.dataset import UpliftDataset

dataset = UpliftDataset(
root: str, # The path where the dataset is stored. info.json or info.csv file must exist.
preprocess: Callable=None, # Preprocessing function. It is optional.
time_transform: Callable=None, # The function to preprocess time data.
# If None, the default preprocessing function is used.
feature_transform: Callable=None, # The function to preprocess feature data.
# If None, the default preprocessing function is used.
target_transform: Callable=None, # The function to preprocess target data.
# If None, the default preprocessing function is used.
y_idx: int=0, # The index of y value. The default is 0.
# 0 means whether there is a login within 3 hours, 1 means within 6 hours,
# and 2 means within 12 hours.
)
info.csv or info.json file should contain the name of parquet file and t (treatment, whether push message was sent) and y (whether login) for each time series.
Split Dataset
In UpliftDataset class, you can split dataset by using split method.
train_set, valid_set = dataset.split(
by: str='random', # # Split dataset by random, user, match, or test.
# If by='random', split dataset by random.
# If by='user', split dataset by user.
# by='match' is not implemented.
# If by='test', split dataset by non-overlapping test dataset.
ratio: float=0.2, # Ratio of validation set.
random_state: int=42, # random_state.
**kwargs,
)
Matching is a common method in uplift modeling and causal inference research. However, there are many ways to do matching, so we do not provide the implementation. If you use by='match', NotImplementedError will occur. You can implement matching by inheriting the UpliftDataset class and using the val_by_match method.
Data Loader
The length of each time series is different. Therefore, collate_fn in dataset/dataset.py implements the basic collate function. collate_fn is used as the collate_fn argument of torch.utils.data.DataLoader.
from dataset.dataset import collate_fn
from torch.utils.data import DataLoader

train_loader = DataLoader(
train_set,
batch_size=32,
shuffle=True,
collate_fn=collate_fn,
)
In this case, collate_fn has two arguments, max_length and pad_on_right. Therefore, if you want to use the arguments, you have to use lambda function.
train_loader = DataLoader(
train_set,
batch_size=32,
shuffle=True,
collate_fn=lambda x: collate_fn(x, max_length=2048, pad_on_right=False),
)
As a result, collate_fn returns a dictionary of the form {str: torch.Tensor}, and each key is as follows.
* timestamp: A torch.Tensor containing time information. The shape of the torch.Tensor is (batch_size, max_length).
* X: A torch.Tensor containing the sequence of API calls. The shape of the torch.Tensor is (batch_size, max_length). It can be LongTensor or FloatTensor depending on the preprocessing method.
* t: A torch.Tensor containing the treatment. The shape of the torch.Tensor is (batch_size,).
* y: A torch.Tensor containing the outcome. The shape of the torch.Tensor is (batch_size,).
Train
You may train the model using the following script. You can check the available arguments using --help. All arguments are defined in args.py.
```bash
python train.py --help
The baseline model code is modified from TS2VEC.
Disclaimer
This dataset is released for research purposes only under CC BY-NC-SA 4.0 license. All responsibility for the results of using this dataset is the responsibility of the user. If you want to share the results of using this dataset, please contact us at the following contact.
nannullna@kaist.ac.kr
The dataset and baseline will be updated through the following github repository, if anything is changed.
https://www.github.com/nannullna/ts4uplift
Citation
Please cite the following paper if you use this dataset.
@inproceedings{
kim2023modeling,
title={Modeling Uplift from Observational Time-Series in Continual Scenarios},
author={Sanghyun Kim and Jungwon Choi and NamHee Kim and Jaesung Ryu and Juho Lee},
booktitle={Continual Causality Bridge Program at AAAI23 },
year={2023},
url={https://openreview.net/forum?id=pKyB5wMnTiy}
}
References
[1] Bai, S.; Kolter, J. Z.; and Koltun, V. (2018). An empirical evaluation of generic convolutional and recurrent networks for sequence modeling. arXiv preprint arXiv:1803.01271.
[2] Yu, F.; and Koltun, V. 2015. Multi-scale context aggregation by dilated convolutions. arXiv preprint arXiv:1511.07122.
[3] Shi, C., Blei, D., & Veitch, V. (2019). Adapting neural networks for the estimation of treatment effects. Advances in neural information processing systems, 32.
[4] Mouloud, B., Olivier, G., & Ghaith, K. (2020). Adapting neural networks for uplift models. arXiv preprint arXiv:2011.00041.
[5] Athey, S., & Imbens, G. W. (2015). Machine learning methods for estimating heterogeneous causal effects. stat, 1050(5), 1-26.
0